Data analyst
From 5,000 rows to the point
A long list of 5,000 rows and the director wants “the story” by lunch.
How it feels: PressureWhat you want instead: Insightful
The problem
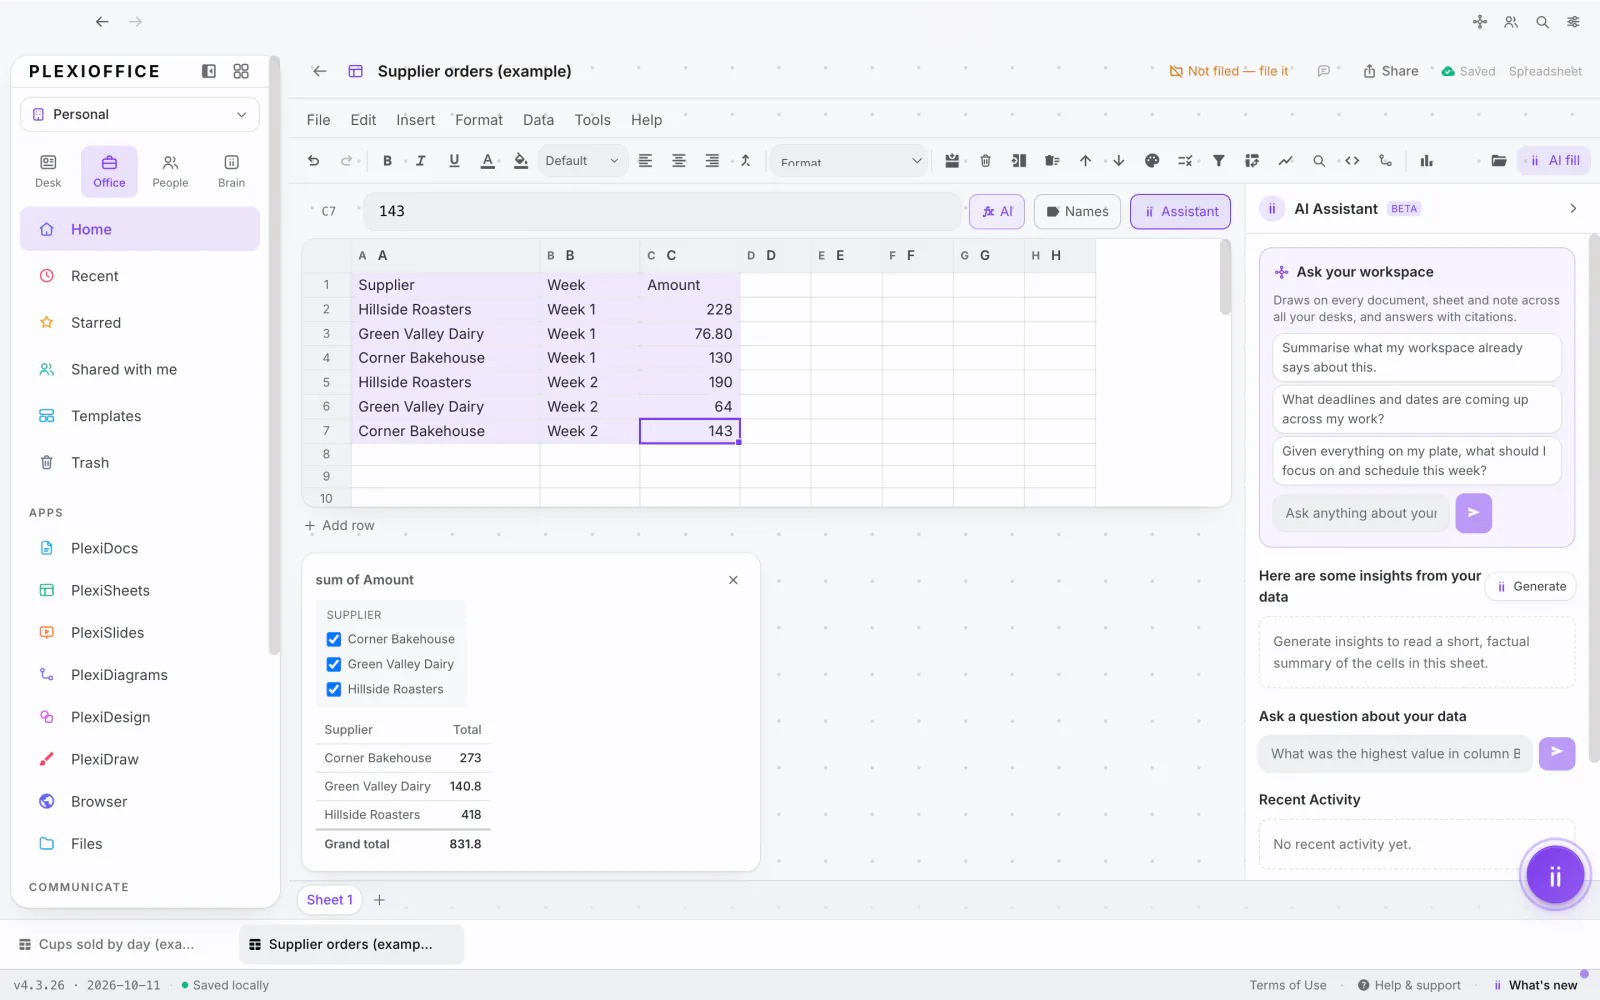
Rows are not a story. Building pivots by hand under time pressure leads to mistakes.
How Plexii handles it
Pivot tables summarise the list in a few lines; conditional formatting colours what matters; the Sheets AI Assistant gives factual insights about the figures.
This uses Plexii’s AI, which runs on Plexii credits or your own Anthropic key. How AI is paid for.
In short: Group, total and colour your data in a few clicks, and ask the assistant what stands out. Then check the figures it points to.
Step-by-step guides
More moments like this
- Software developer
Back from the incident, back on track
Release week, and an incident drags you away from the feature you were halfway through.
- Product manager
Disagree on the page, not in five threads
Writing a PRD while three teams disagree in different threads.
- Business analyst
Every version, without “final_v3_REAL”
Sign-off meeting, and you cannot prove which version of the requirement was agreed.