Chart work widget
A chart that keeps itself up to date
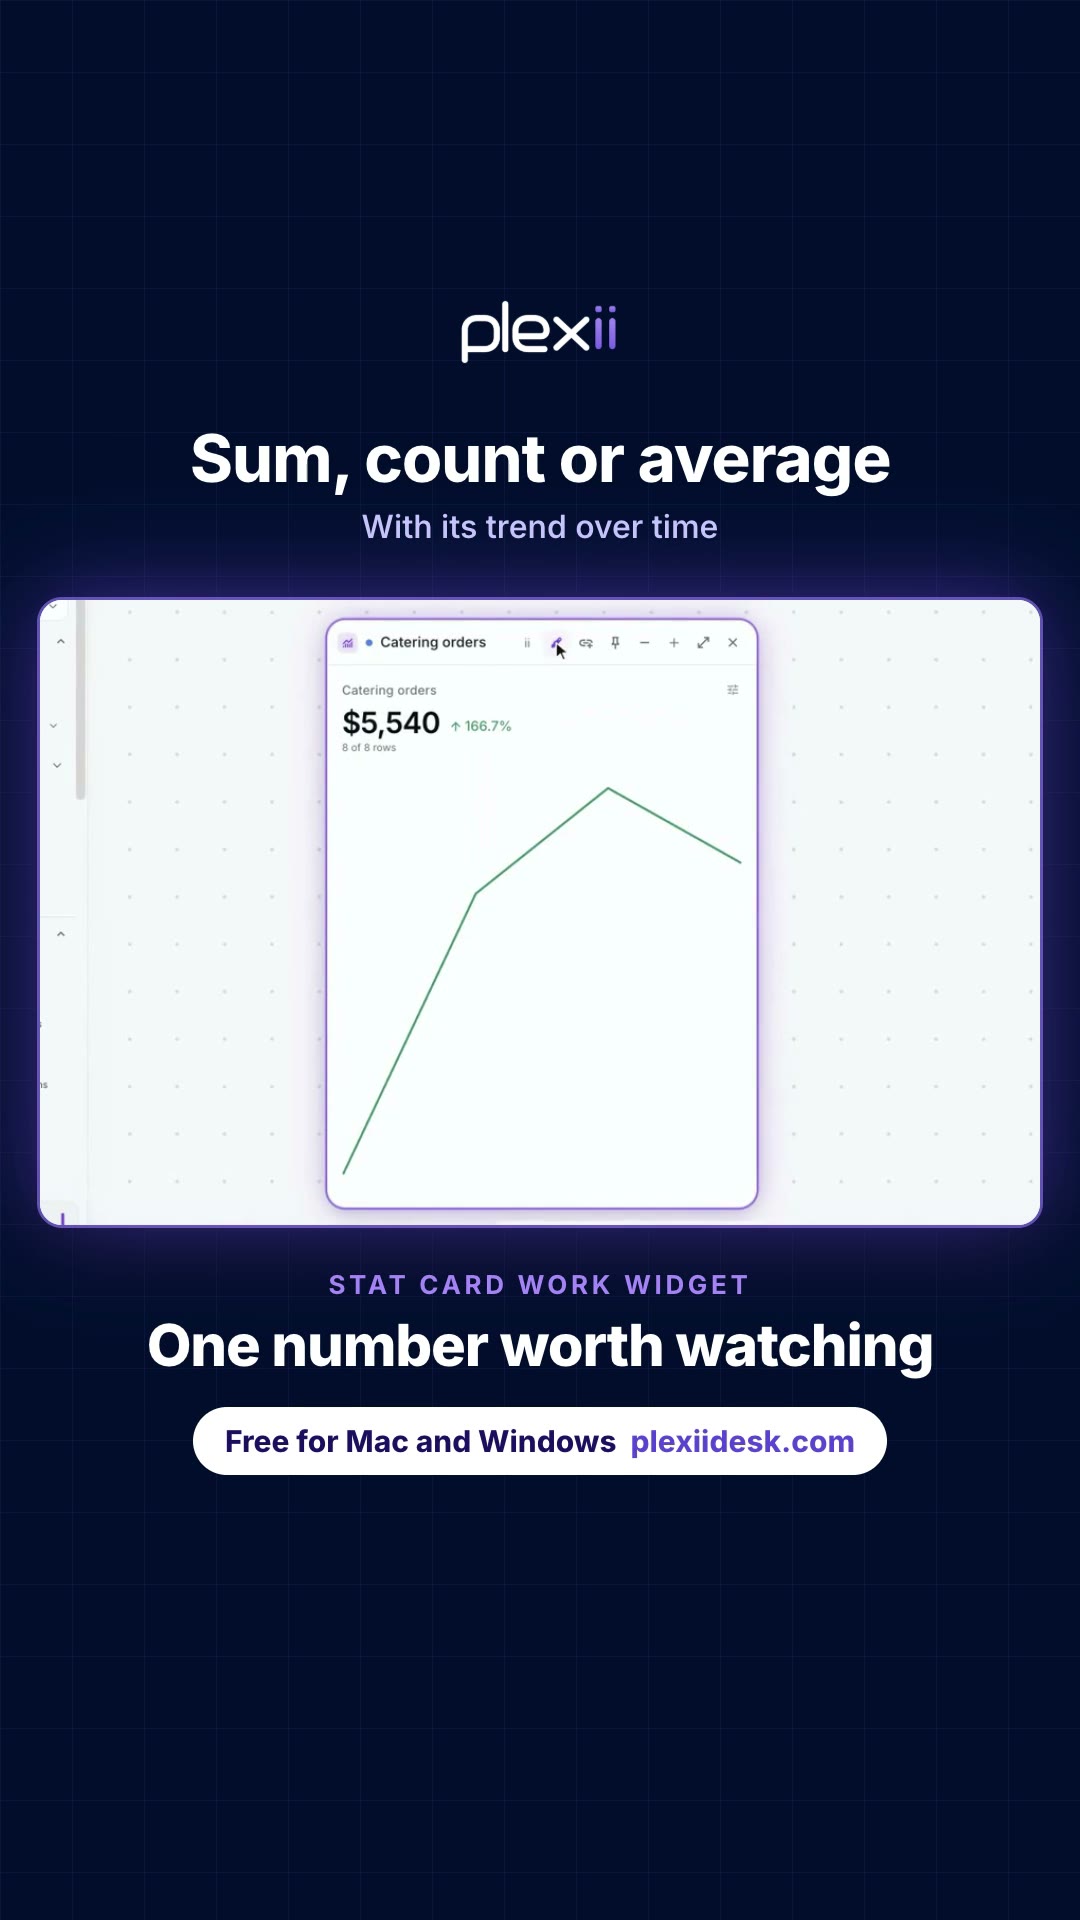
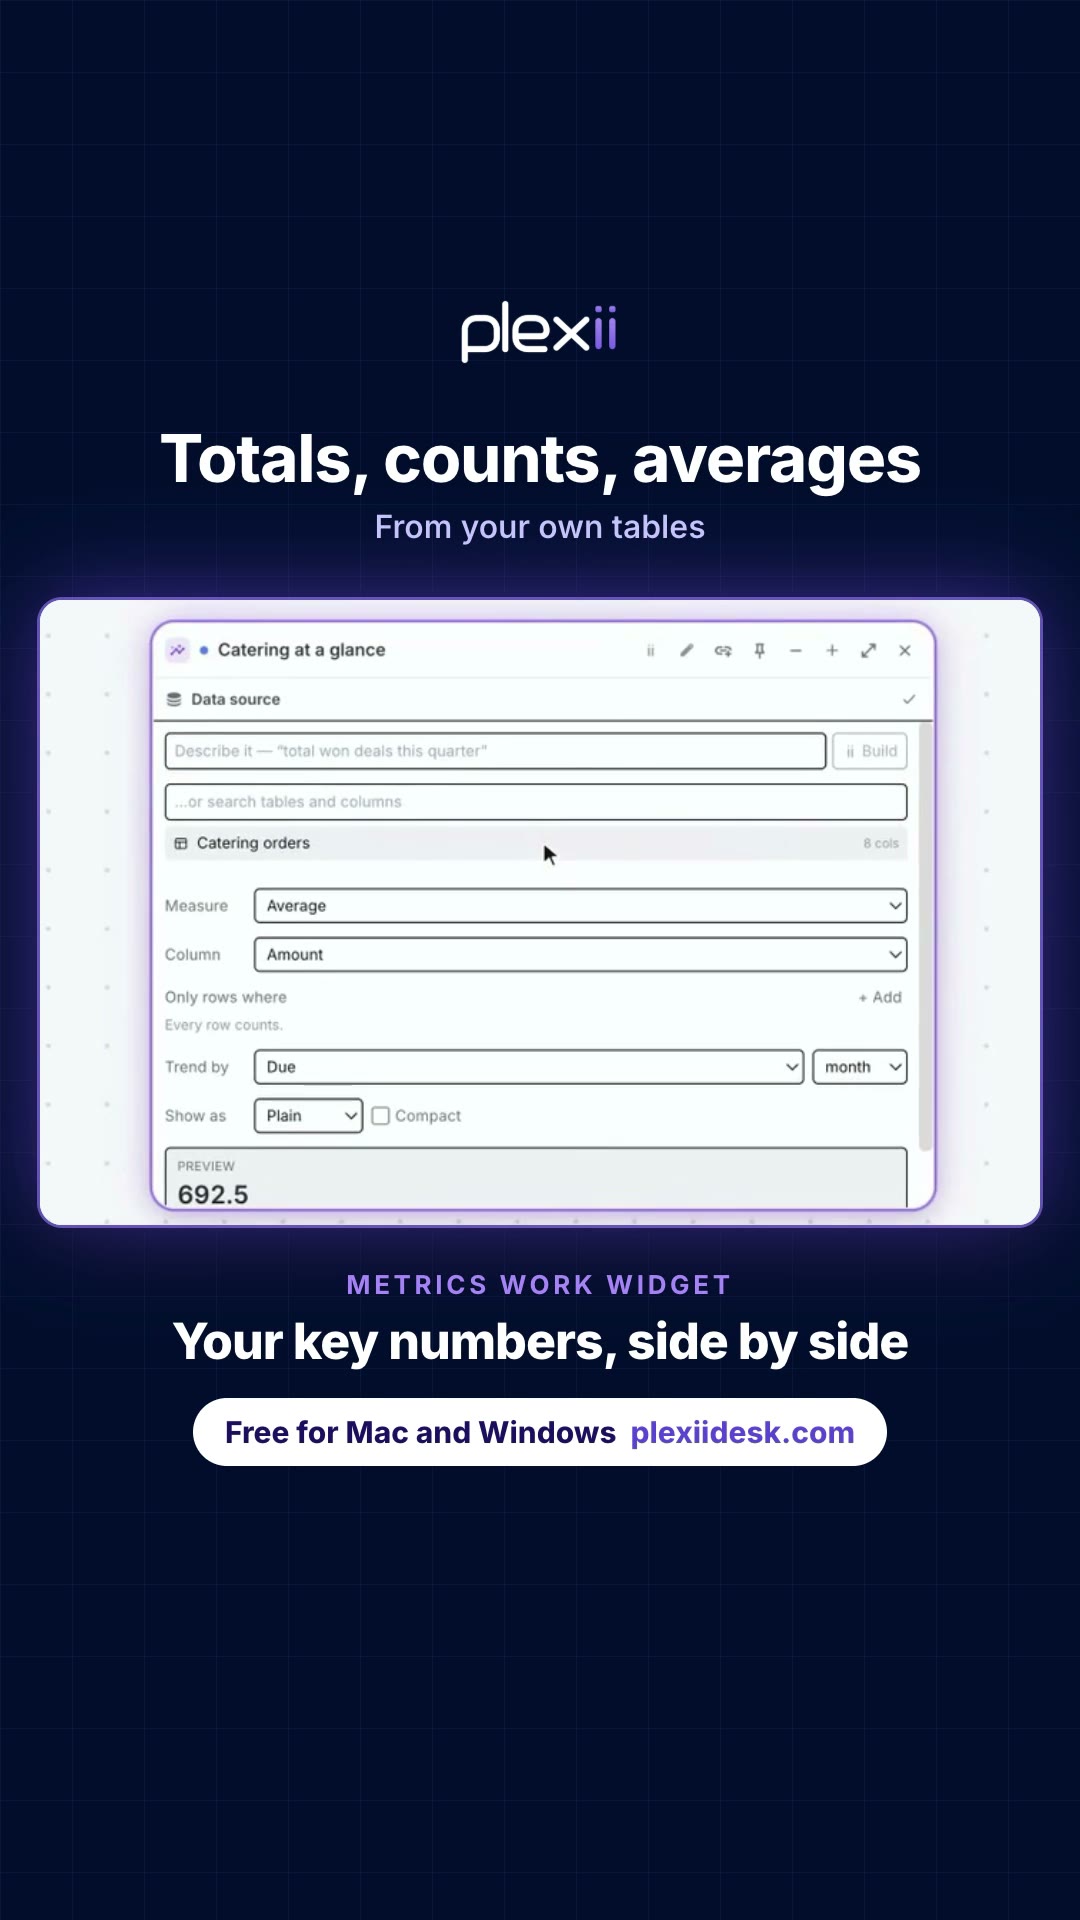
A bar, line, area or pie chart, or one big number, drawn from a table and redrawn as it changes.
What it is for
A bar, line, area or pie chart, or one big number, drawn from a table and redrawn as it changes.
How it helps
No more exporting to make a graph: the chart reads the table on the desk and changes when the rows do.
- Exporting just to make a graph? Then doing it again next week
- A Chart, on the desk Pick a table and a column
- Drawn from your rows Bars, lines or a pie
- Redraws itself Whenever the table changes
The Chart widget guide shows how to add it and every option it has.
More work widgets

Transcript
Exporting data just to draw a chart? Point a Chart work widget at a table on the desk. Pick what to count, and it draws itself. Change a row, the chart follows. Plexii. Free for Mac and Windows.
Real PlexiDesk app footage with sample data. The voice is AI-generated.