Writing an investor update where every number agrees
A structure for monthly investor updates you can reuse, and how to keep the figures in the update, the deck and the model from drifting apart.
A good investor update is short, regular, honest and consistent. It arrives at the same time every month, follows the same structure, reports the same key numbers in the same order, and its figures match the deck and the model exactly.
The structure is easy: a reusable template fixes it in an afternoon, and you will find one below. Consistency is harder, because the numbers live in several places and drift apart a little more every time one of them changes. The fix for that is one source for every number, and a short check before you press send.
What investors want from an update
Think about what an update is for. Your investors cannot see inside the company between board meetings, so the update is their view of it. That suggests what a good one does:
- It is regular. The same week every month builds a record. A gap says something too.
- It is brief. One screen of text and a handful of numbers is enough. Detail can go in an appendix or a linked page.
- It is honest. Bad news early, with what you are doing about it, is far easier to hear than bad news late.
- It is consistent. The same measures, defined the same way, month after month, so trends are visible and nobody has to wonder whether a definition quietly changed.
- It asks for something specific. The update reaches all your investors in the same week, which makes it a good moment to ask for help. Use it.
If you would like to see a whole raise laid out on one screen while you read, you can build a founder's desk in the interactive demo by choosing your role and describing the raise you are working on.
A structure you can reuse every month
Six parts, in this order:
- Headline. One or two sentences: the month in brief, good or bad.
- Key numbers. The same five to eight measures every month, in the same order, each shown next to last month and the plan. Typical ones are sales for the month, cash in the bank, net burn and runway in months, plus the one or two measures that drive your particular business, such as active accounts or pipeline.
- Highlights. Up to three, one line each, with why each one matters.
- Lowlights. Up to three, each with what you are doing about it.
- Asks. Specific and easy to act on: an introduction to a named company, help with a hire, a view on a decision you are weighing.
- Next month. Two or three priorities, so next month's update can report against them.
Write your definitions down once and keep them with the template. "Runway is cash in the bank divided by average net burn over the last three months" is the kind of line that saves an awkward conversation later. Change a definition rarely, and say so in the update when you do.
Why the numbers drift apart
The same figure usually appears in at least three places: the model, the pitch deck and the update. Each one is touched at a different moment, by hand. That is where the drift comes from:
- Retyping. A number typed into the update from memory, or from last week's email.
- Different moments. The model updated after the month closed, a deck chart made two weeks earlier, an update written halfway between.
- Different definitions. Gross burn in one place and net burn in another; a calendar month here and the last 30 days there.
- Rounding. A figure rounded one way in the deck and another way in the update.
- Copies of copies. A chart pasted into the deck as a picture, which will never change again.
Every one of these has the same root: one number lives in several places, and each copy is kept up to date by hand. When an investor spots two different runway figures, the conversation turns to the discrepancy instead of the company.
PlexiDesk, the Plexii app for Mac and Windows, can help here. The update, the model and the deck can sit side by side on one desk for the raise, and its charts read their numbers from your own tables and sheets rather than from figures typed in by hand. The next section shows how to set that up, starting with the part that works in any tool.
One source for every number
The general fix works with any tools. Keep one table of key numbers: one row per month, one column per measure, with your definitions beside it. Close the month in that table first. Then everything else reads from it: the update, the deck's charts and any dashboard. Never type a figure into the update that you did not copy from the source at the time of writing.
In PlexiDesk, two kinds of widget hold numbers, and it helps to know which reads which.
- Tables feed the dashboard. A Table keeps rows with typed columns, and Charts, Metrics and Stat cards read their numbers from tables. You can build a dashboard on a desk from a table: for example, a line Chart of cash by month and another of sales by month, with Metrics and a Stat card beside them for the figures you watch most. They update by themselves when the table's rows change, so there is nothing to refresh.
- Spreadsheets hold the model. A Spreadsheet widget puts a PlexiiSheets spreadsheet on the desk, with formulas, several tabs and .xlsx import and export. Describe a calculation and Plexii writes the formula, previewed before it writes.
- Slide charts link to a spreadsheet. In the Slides widget, a new chart starts on sample figures, labelled as sample data, until you link it to a range in a spreadsheet. A linked chart reads the first tab of the spreadsheet you choose, and keeps the figures from the last time it was refreshed. Refresh from sheet, in the chart's settings, pulls the current ones.
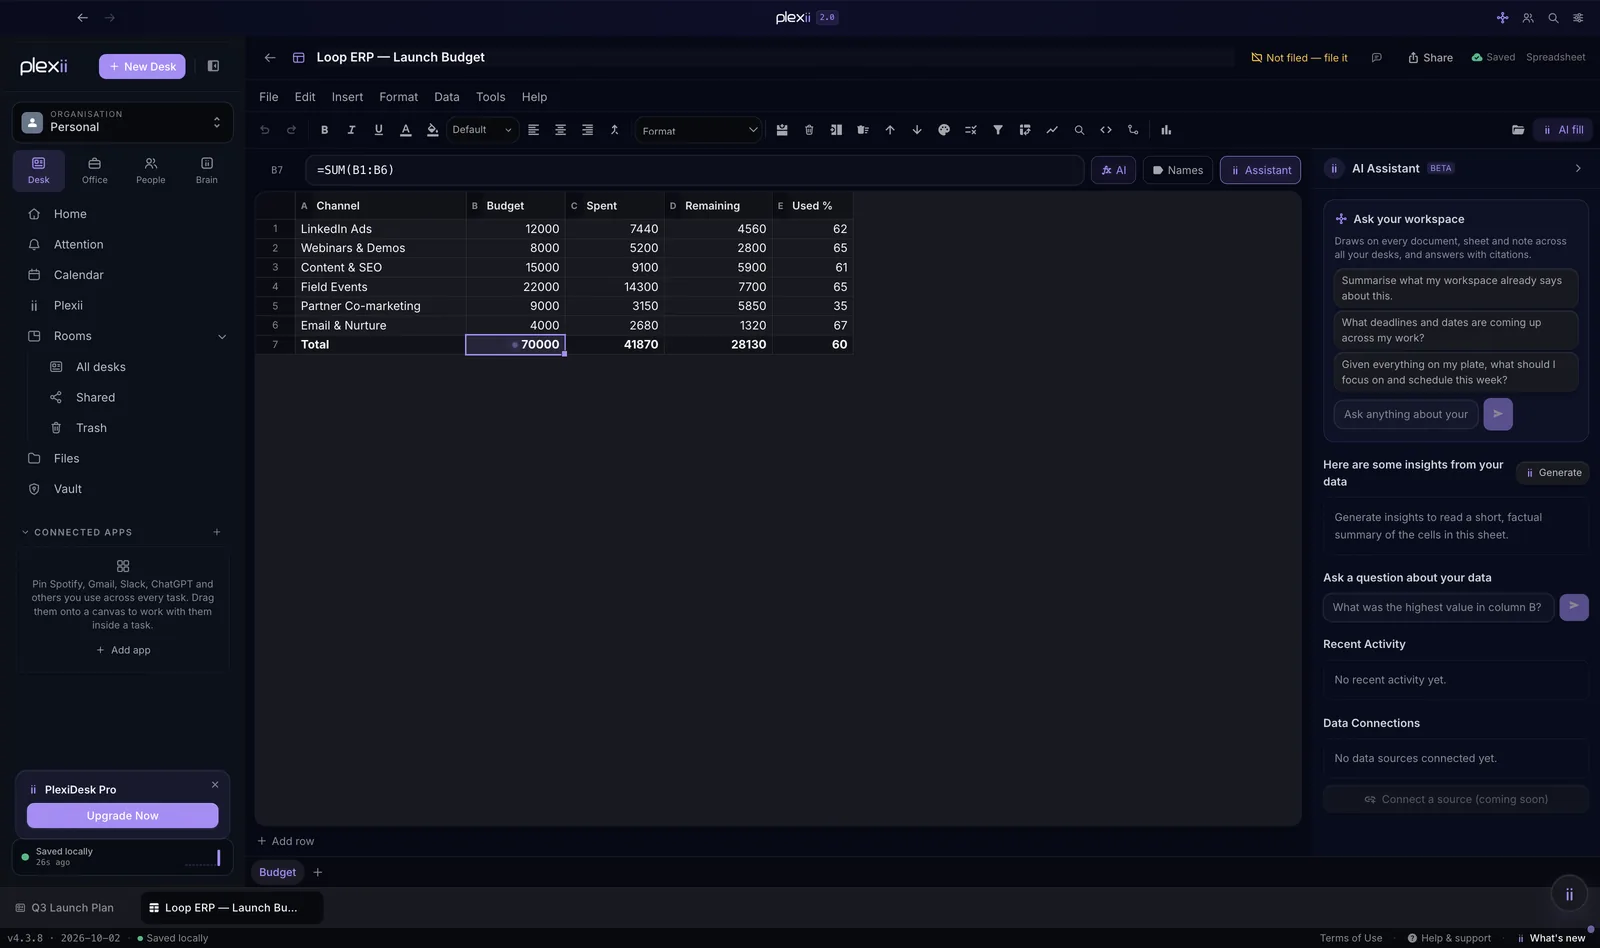
So desk charts read tables, and slide charts read spreadsheets. If a number appears in both, decide which one is the original. A simple arrangement: the model's first tab holds the monthly key numbers, and the deck's charts link to it. If you also want a dashboard on the desk, paste each month's row from the sheet into the table (cells copy and paste between a table and a spreadsheet) rather than typing it again. Copy in one direction, at one moment, and the two never disagree for long.
Check before you send
Give every update the same short check before it goes out:
- Trace every number. Find each figure in the update in your source, for the same month and with the same definition.
- Refresh, then compare the deck. Update any linked charts, then check the deck's headline numbers against the update.
- Check the arithmetic. Totals add up, percentages use the same base, and runway agrees with cash and burn.
- Compare with last month. This month's "last month" column should match what you actually sent last month. If you restated a figure, say so and say why.
- Check the asks and links. Each ask names what you need and from whom, and every link opens.
- Read it once as an investor. Would the headline and the numbers tell the same story without the rest?
Plexii, the assistant built into PlexiDesk, can help with the comparison when you ask. Type @ to point it at the update, the model and the deck, and ask whether the figures agree. It answers from those files and lists the sources it used, so you can open each one and see for yourself. If it spots numbers that disagree, it suggests a fix as a card, and at the default setting nothing changes until you apply it. Treat it as a second pair of eyes; you still read the numbers yourself before anything goes out. Plexii needs AI to run: PlexiDesk AI credits while you are signed in, or your own Anthropic key. The Plexii section of the product tour shows how its sources and cards work.
Keep the raise on one desk
A raise is several jobs at once: the deck, the model, the investor pipeline, the data room, the emails and the monthly update. When each lives in a different place, keeping them in step becomes a job of its own.
PlexiDesk gives the raise one desk, as the page for start-up founders shows. On it you can keep:
- The update, in a Document widget, exported to PDF or Word when you need a file.
- The model, in a Spreadsheet widget, imported from your .xlsx and exported again when someone asks for it.
- The deck, in a Slides widget, downloaded as .pptx or PDF when you send it.
- The key numbers table and the dashboard that reads it.
- The investor pipeline, as a table with a Stage column you can view as a Kanban board.
With the update, the model and the deck side by side, the check before sending is a matter of looking across one desk instead of opening four files. The office suite on the canvas covers what PlexiiDocs, PlexiiSheets and PlexiiSlides can each do.
The same one-desk approach works well beyond fundraising; a listing checklist for real estate agents shows it in a very different job. To try it with your own raise, build a founder's desk in the interactive demo, then set up the real one when the next month closes.